Looking at Q1 financing metrics by geography
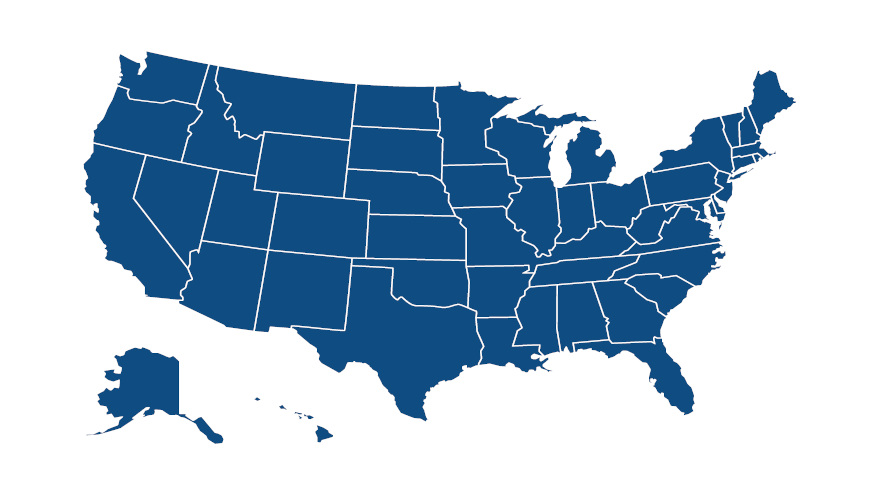
Image by Rostik Solonenko / Shutterstock.com
By subscribing, you agree to receive communications from Auto Remarketing and our partners in accordance with our Privacy Policy. We may share your information with select partners and sponsors who may contact you about their products and services. You may unsubscribe at any time.
SCHAUMBURG, Ill. –
Along with highlighting how total outstanding balances are approaching $1.3 trillion, Experian’s Q1 2021 State of the Automotive Finance Market report also delved into some metrics based on geography.
Experian pinpointed the average credit score of used-vehicle paper bought in Q1 by state. The top 10 lowest averages where perhaps the most subprime financing took place included:
1. Mississippi: 635
2. Alabama: 640
3. Georgia: 643
4. North Carolina: 645
5. Texas: 645
6. Maryland: 647
7. South Carolina: 647
8. Oklahoma: 651
9. Tennessee: 652
10. Florida: 658
On the new-vehicle side, Experian noticed the average crept out of the non-prime space but involved many of the same states, including:
1. Maryland: 708
2. Mississippi: 710
3. New Mexico: 710
4. Texas: 710
5. Georgia: 711
6. West Virginia: 712
7. Alabama: 713
8. Louisiana: 714
9. Oklahoma: 715
10. North Carolina: 716
Experian also share a breakdown of regional percentages by provider, including banks, credit unions, captives, as well as what analysts classify as finance companies that often serve the subprime market along with a final category simply dubbed, other.
Subscribe to Auto Remarketing to stay informed and stay ahead.
By subscribing, you agree to receive communications from Auto Remarketing and our partners in accordance with our Privacy Policy. We may share your information with select partners and sponsors who may contact you about their products and services. You may unsubscribe at any time.
Here are those figures for used financing:
West
Bank: 26.58%
Captive: 11.12%
Credit union: 31.78%
Finance company: 15.55%
Other: 14.95%
Midwest
Bank: 36.42%
Captive: 6.65%
Credit union: 28.23%
Finance company: 14.95%
Other: 13.75%
South
Bank: 31.69%
Captive: 7.91%
Credit union: 19.01%
Finance company: 18.87%
Other: 22.52%
Northeast
Bank: 41.98%
Captive: 14.90%
Credit union: 20.54%
Finance company: 14.30%
Other: 8.28%
And as you might expect since they’re directly connected with the automaker, Experian highlighted that captives led the way in each region for new-vehicle financing in Q1. Here are those details
West
Bank: 24.27%
Captive: 54.13%
Credit union: 13.61%
Finance company: 1.59%
Other: 6.41%
Midwest
Bank: 28.60%
Captive: 55.66%
Credit union: 9.36%
Finance company: 5.58%
Other: 0.80%
South
Bank: 29.48%
Captive: 49.20%
Credit union: 11.43%
Finance company: 8.85%
Other: 1.05%
Northeast
Bank: 22.36%
Captive: 67.69%
Credit union: 5.63%
Finance company: 2.02%
Other: 2.30%