Primary outlook: What do New Hampshirites drive?

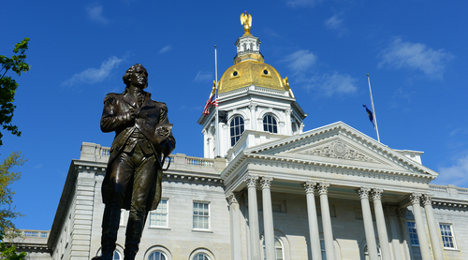
New Hampshire State House in Concord, N.H.
By subscribing, you agree to receive communications from Auto Remarketing and our partners in accordance with our Privacy Policy. We may share your information with select partners and sponsors who may contact you about their products and services. You may unsubscribe at any time.
SANTA MONICA, Calif. –
The recent Iowa caucuses are in the books and it’s time to shift the political focus to Tuesday’s New Hampshire primaries.
Similar to the tight legislative races vying for each party’s presidential nominations, the Edmunds.com data for New Hampshire shows that many of the state’s new-car buying tendencies are similar to the national averages.
Let’s break it down by the numbers. Forty-two percent of new-car purchases made in 2015 in the United States were bought from domestic brands. In New Hampshire, just under 40 percent of the vehicles bought last year were domestic.
One area New Hampshire differs substantially from the rest, however, is in the purchase of Japanese-made vehicles. Forty-six percent of the new vehicles sold in New Hampshire last year were Japanese, compared to the national average of 41 percent.
Another area where New Hampshire is similar to the national scope is by vehicle type. SUVs made up 41 percent of the state’s purchases last year, compared to 37 percent nationally.
This was followed by 37 percent cars (44 percent nationally), 18 percent trucks (15 percent nationally) and 4 percent vans (the same as the national average).
Subscribe to Auto Remarketing to stay informed and stay ahead.
By subscribing, you agree to receive communications from Auto Remarketing and our partners in accordance with our Privacy Policy. We may share your information with select partners and sponsors who may contact you about their products and services. You may unsubscribe at any time.
Following Iowa’s theme of blue-collar status, New Hampshire showed a substantially lower average number of luxury new-car sales last year, with a take rate of 8 percent (compared to the national average of 13 percent).
The state fell almost perfectly in line with the national average of sales share by fuel type, with the majority being gasoline-powered (85 percent in N.H., 83 percent nationally), followed by 11 percent flexible-fueled (11 percent both in N.H. and nationally), diesel (3 percent both in N.H. and nationally), hybrid-powered (2 percent in N.H., 3 percent nationally) and EVs (0.1 percent in N.H. and 0.4 percent nationally).
To check out our similar analysis of vehicles sold in Iowa last year, click here.


