Takata Airbag Recall Effect on Used Pricing

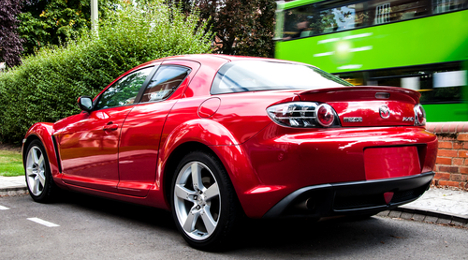
The first generation Mazda RX-8 was the vehicle that took the hardest depreciation hit due to the Takata airbag recall, according the report from iSeeCars.com.
By subscribing, you agree to receive communications from Auto Remarketing and our partners in accordance with our Privacy Policy. We may share your information with select partners and sponsors who may contact you about their products and services. You may unsubscribe at any time.
WOBURN, Mass. –
The effects of a recall can do quite a bit more harm to a vehicle’s image than the immediate problems they typically cause – they can also dramatically accelerate their rate of value depreciation.
That’s according to the analysts at iSeeCars.com, who recently released the results of a study they conducted to see the effect of a specific situation, the Takata airbag recall, on the depreciation rate of the vehicles they were in.
Their findings are staggering – according to their results, based on an analysis of over 19 million used vehicles including vehicles recalled for potential issues with Takata airbags and comparable, unaffected models, the affected vehicles saw an average of 2.2 times higher price drops than vehicles not under the airbag recall.
Based on data during the recall period, from Oct. 2014 to Feb. 2015, Takata-affected vehicles saw a price decline of 7.1 percent year-over-year, compared to a 3.2 percent decline in price for vehicles not affected.
“It seems like the dramatic risk of injury associated with these defective airbags may have led to a decrease in perceived value,” said Phong Ly, iSeeCars.com’s chief executive officer. “Since most consumers trade in their cars rather than sell them privately, it means they’re getting hit even harder on their trade-in values.”
The study also narrowed its focus to identify the individual vehicles hit hardest by these perceptions, noticing that the average price decline for the top-10 models ranged from 1.3 to 3.5 times more than the average decline for similar vehicles not subject to the same recall. Here is that list, provided by iSeeCars.com.
Subscribe to Auto Remarketing to stay informed and stay ahead.
By subscribing, you agree to receive communications from Auto Remarketing and our partners in accordance with our Privacy Policy. We may share your information with select partners and sponsors who may contact you about their products and services. You may unsubscribe at any time.
10 Takata-Recalled Cars With the Biggest Price Drops
|
Rank |
Takata-Affected Model |
Model Years |
% Avg Price Change YOY |
% Avg Price Change YOY for Similar Cars |
Price Drop Compared With Similar Cars |
|
1 |
Mazda RX-8 |
2004–2008 |
−12.0% |
−3.4% |
3.5x Greater |
|
2 |
Infiniti FX35/45 |
2003–2005 |
−13.0% |
−5.1% |
2.6x |
|
3 |
BMW 3 Series* |
2000–2006 |
−13.4% |
−7.1% |
1.9x |
|
4 |
Dodge Dakota |
2005–2008 |
−7.2% |
−4.0% |
1.8x |
|
5 |
Toyota Tundra |
2003–2005 |
−7.5% |
−4.9% |
1.5x |
|
6 |
Nissan Maxima |
2001–2003 |
−12.5% |
−8.8% |
1.4x |
|
7 |
Honda CR-V |
2002–2006 |
−11.6% |
−8.8% |
1.3x |
|
8 |
BMW M3 |
2001–2006 |
−9.2% |
−7.0% |
1.3x |
|
9 |
Dodge Durango |
2005–2008 |
−11.6% |
−9.1% |
1.3x |
|
10 |
Honda Pilot |
2003–2007 |
−11.5% |
−9.1% |
1.3x |
* Coupe and convertible.


