Despite challenging Q1, dealers see strong market ahead for Q2

Chart courtesy of Cox Automotive.
By subscribing, you agree to receive communications from Auto Remarketing and our partners in accordance with our Privacy Policy. We may share your information with select partners and sponsors who may contact you about their products and services. You may unsubscribe at any time.
Monday marked the first business day — or perhaps the third sales day depending on your dealership’s hours of operation — of the second quarter, which most dealers view as strong for the market.
That’s the conclusion from survey results of the Cox Automotive Dealer Sentiment Index (CADSI), which also recapped the soft views principals and managers had about the first quarter.
Dealer sentiment went into Q2 at a level like the one Cox Automotive recorded to close 2022. At 43, the index reading happened to be also at the lowest level since the height of the global COVID-19 pandemic.
With the Q1 index 50, it indicated more dealers viewed the auto market as weak. The Q1 index remained stable quarter-over-quarter but down 14 points year-over-year.
But perhaps the future is bright.
Cox Automotive indicated the three-month, forward-looking market outlook index rose sharply to 52, up from 41 in Q4. In spite of factors holding back their business, analysts pointed out that the increase breaks a trend of three consecutive quarters with a declining market outlook.
Subscribe to Auto Remarketing to stay informed and stay ahead.
By subscribing, you agree to receive communications from Auto Remarketing and our partners in accordance with our Privacy Policy. We may share your information with select partners and sponsors who may contact you about their products and services. You may unsubscribe at any time.
However, even with the improvement, Cox Automotive acknowledged the market outlook remains below last year’s Q1 score of 64, when dealers were entering 2022 with a stronger sense of optimism.
“Despite high interest rates and stubborn inflation, the U.S. consumer continues to prop up the economy,” Cox Automotive chief economist Jonathan Smoke said in a news release. “Auto sales are slow by historical standards, but the sales pace has been improving in early 2023, giving dealers reason to feel somewhat optimistic about the year ahead.”
Profits remain under pressure
The overall profit index declined to 42, down from 44 last quarter and down significantly from 54 a year earlier.
The profit index reached record highs in late 2021 and in the early part of 2022 — particularly for franchised dealers — but has declined for six straight quarters, according to Cox Automotive.
While the profit index is now well below the threshold of 50, Smoke pointed out that it continues to be propped up by franchised dealers who believe profits remain particularly strong at 63.
Conversely, Smoke mentioned independent dealers now see profits as weak, with an index score of only 36.
“For franchised dealers selling new vehicles at or above MSRP, the profit picture continues to be very strong,” Smoke said. “The profit index for franchised dealers is down from the records seen in 2021 but still healthy and well above the long-term, pre-pandemic level. Unfortunately, for independent dealers, it’s a different story altogether.”
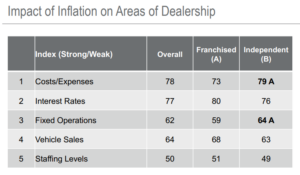
In Q1, analysts found that the cost index — specifically the cost of running a dealership — climbed 3 points quarter-over-quarter to 75. The reading is now 1 point below the record high recorded in Q2 of last year.
After reaching a record low of 51 at the height of the pandemic, Cox Automotive said the cost index has steadily increased.

Chart courtesy of Cox Automotive
Used-vehicle sales still challenging even as inventory improves
Cox Automotive reported that the new-vehicle inventory index improved in the first quarter and is up significantly from one year ago, spiking from 25 to 63.
Analysts explained the new-vehicle inventory index indicates more franchised dealers feel their inventory is growing, not declining.
Cox Automotive said the new-vehicle inventory mix index has also been increasing, too, rising from 41 in Q4 to the threshold of 50 in Q1, indicating dealers are generally neutral on their view of the current mix, with half indicating it is good and half indicating it is poor.
In Q1 2020, before the start of the pandemic, the new-vehicle inventory mix index was 73.
“Overall, both new-vehicle inventory indexes continue to improve notably as supply chain issues are sorted and manufacturers have ramped up production,” Cox Automotive said.
Meanwhile, analysts also mentioned the used-vehicle inventory index improved in Q1, too. Coming in at 43, that’s 1 point higher than the previous quarter and 7 points higher year-over-year.
Unlike new inventory, franchised dealers noted their used-vehicle inventory was declining in Q1. Among franchised dealers, the used-vehicle inventory level index improved by 4 points year-over-year to 49, just missing the threshold of 50.
Analysts noted the index for independent dealers saw a 7-point gain year-over-year to 40.
Cox Automotive added the used-vehicle inventory mix index improved quarter-over-quarter and year-over-year to 52, marking the first time the index score was above the threshold of 50 since Q1 2021.
“Overall, franchised dealers continue to be far more positive about inventory than independent dealers. However, consistent with last quarter, Limited Inventory ranks as one of the top factors holding back business for dealers in Q1,” analysts said.
Majority of dealers feeling pressure to lower prices
The important price pressure index increased in Q1 to 60, up from 57 in Q4, the fifth consecutive quarterly increase.
At the current reading of 60, Cox Automotive explained the price pressure index indicates a majority of dealers are feeling pressure to lower prices.
“Interestingly, the pressure to lower prices is being felt equally among franchised and independent dealers with scores of 59 and 60, respectively,” analysts said. “The index is significantly higher than a year ago when it was 37 but remains below pre-pandemic levels when it averaged 64.”
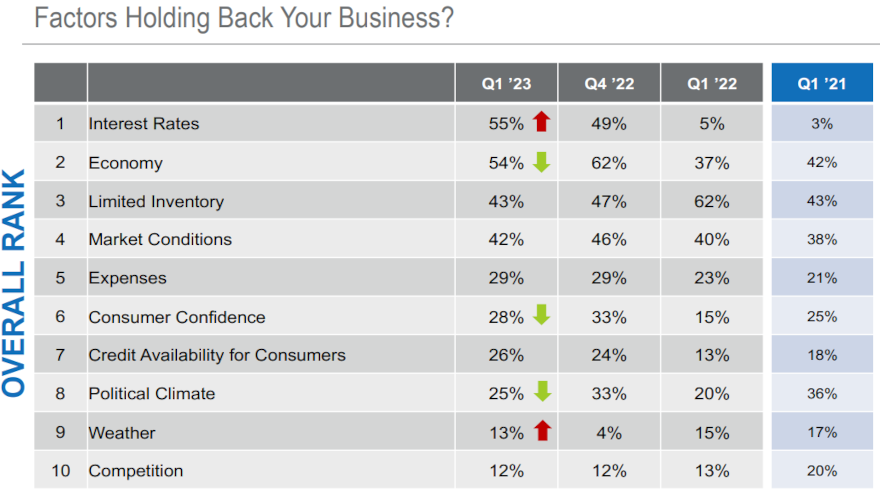
Overall, Cox Automotive found that interest rates are now the top factor holding back dealer business in the U.S., with 55% noting it as their primary concern. Economy (54%), limited inventory (43%), market conditions (42%) and expenses (29%) round out the top five factors holding back business.
The Q1 2023 CADSI is based on 1,022 U.S. auto dealer respondents, comprising 571 franchised dealers and 451 independents. The survey was conducted from Jan. 30 to Feb. 13.
Dealer responses were weighted by dealership type and sales volume to represent the national dealer population. For each aspect of the market surveyed, respondents are given an option related to strong/increasing, average/stable, or weak/decreasing, along with a “don’t know” opt-out.
Indices are calculated by creating a mean score in which:
Strong/increasing answers are assigned a value of 100.
Average/stable answers are assigned a value of 50.
Weak/declining selections are assigned a value of 0.


